Graphs and Single Line Diagram Areas
Graphs area and Single Line Diagram area are where the selected graphs from the toolbar is shown together with a single line diagram of the selected node originated from the active source. This region is reactive to mouse activity: Depressing the mouse wheel and dragging the screen will let the user to navigate, and using the mouse wheel will zoom in or zoom out.
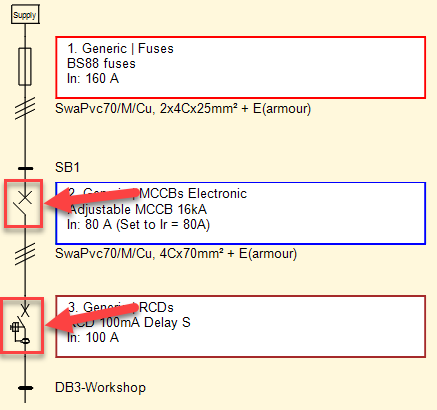
Single Line Diagram will dynamically change as the user selects different nodes from the System Tree Section. The diagram will indicate if a device is an overload device or an RCD with different symbols, and will also indicate if the conductor/cable is a three phase or a single phase.
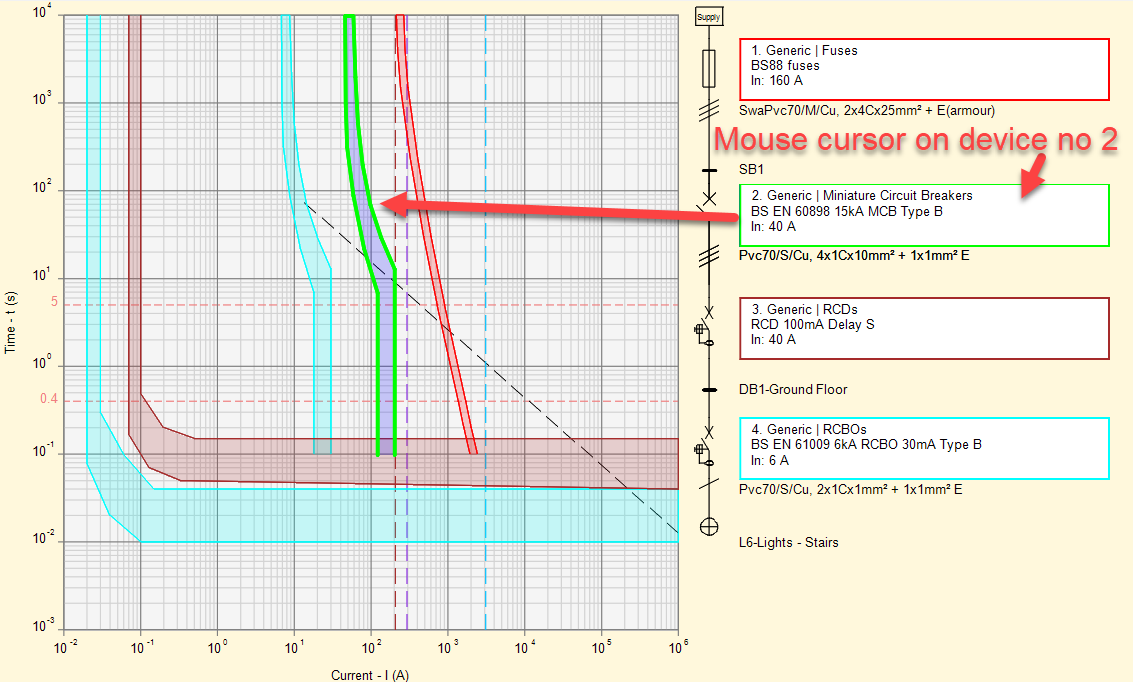
The data boxes next to the protective devices are colour coded and they are matched with the curves shown on the graphs. As teh user hovers on these boxes, ElectricalOM will highlight the data box and the corresponding curve with green.