Side Panel
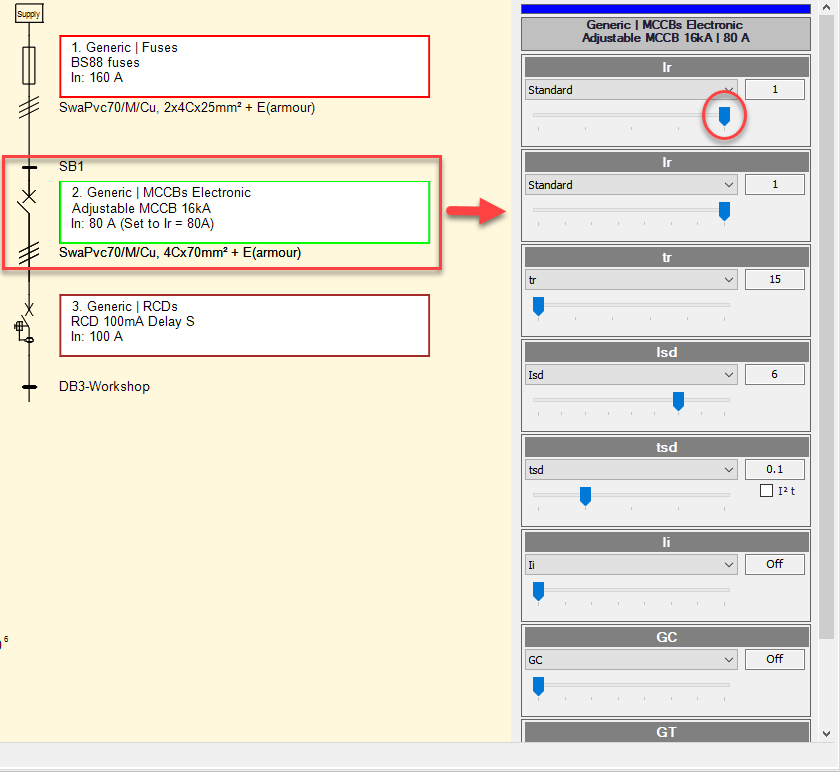
The side panel will display protective device data too, but moreover, if a device with adjustable settings is selected, the side panel will also display these settings where the user can use the sliders to change any value. Changing values will affect the curves at the graphs area and corresponding change will be reflected to the curve of the related protective device.