Toolbar
The toolbar has both common buttons like Apply changes, Cancel, Print, and Extract, and module specific buttons and drop down lists.

- Apply changes will apply the changes made by the user so ElectricalOM will finalise the calculations and check according to new settings.
- Cancel will revert back the changes done by the user to its previous state.
- Print button will initialise the print preview screen. This will create a minimum of a two page document which the first page contains the graphs are and the single line diagram area, and the following pages contain any protective device settings if applicable. The user may chose to print the document by using the Print button, or to export the document to a PDF file by using the Export to Pdf button.
- Extract button lets the user to export the contents of the graphs area and the single line diagram area into a CAD format. The pdf option within Extract context is not the same as the Export to Pdf the latter being a picture format rather than a CAD based drawing.
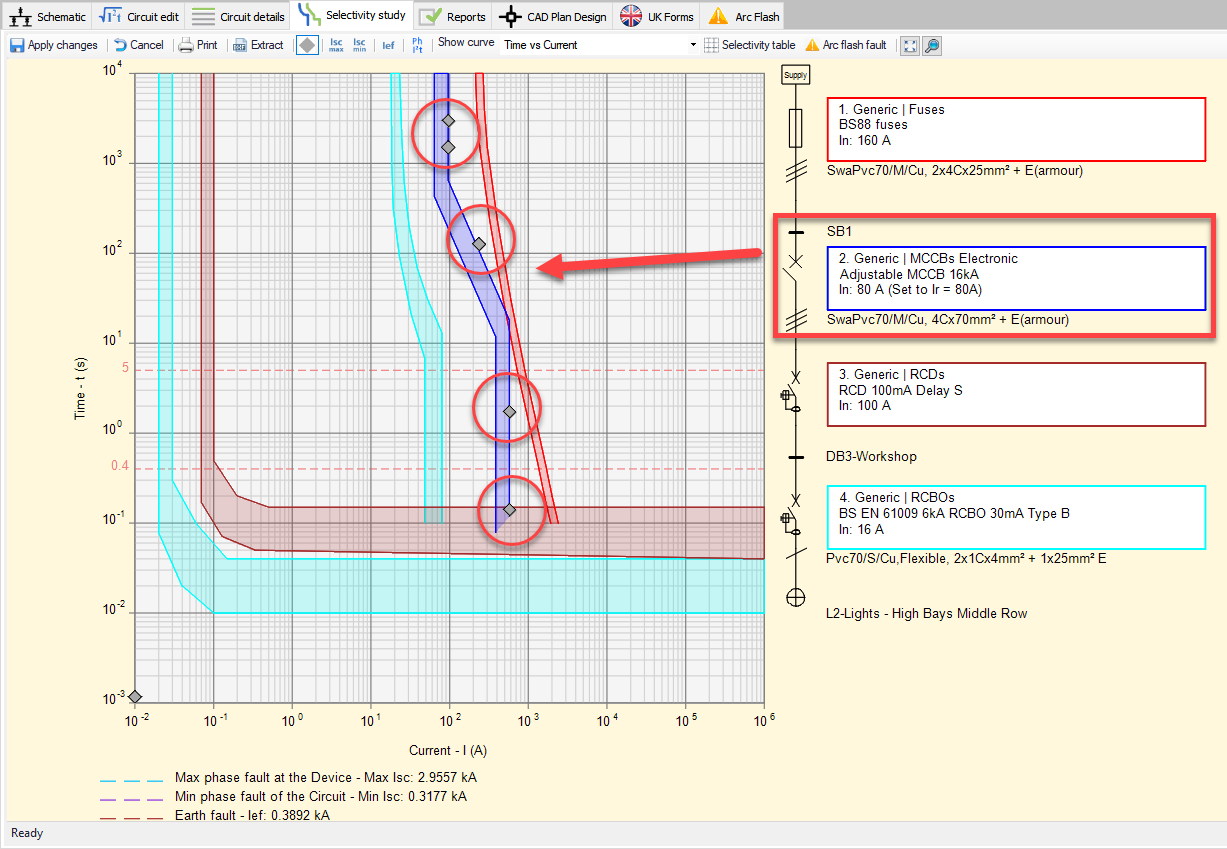
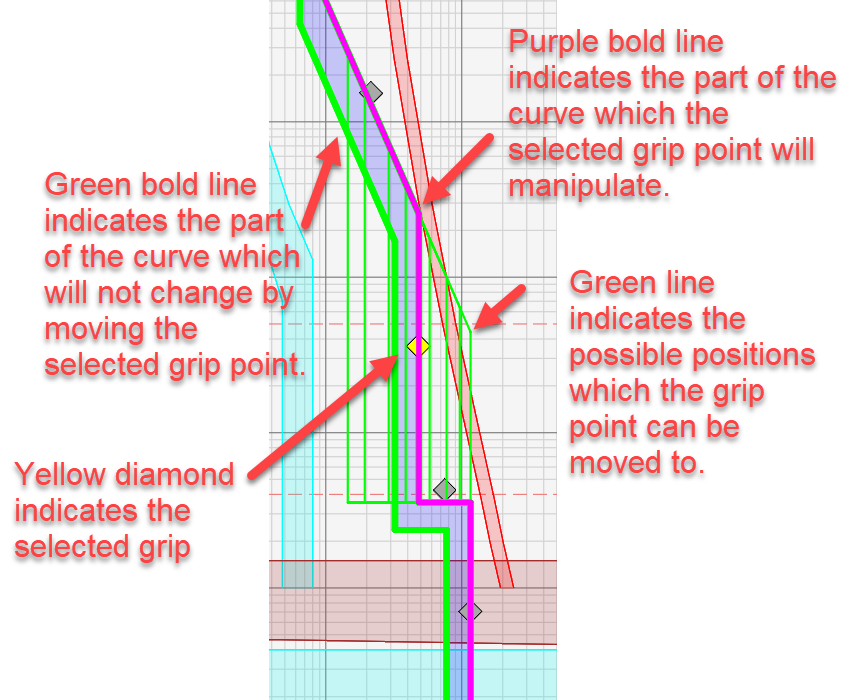
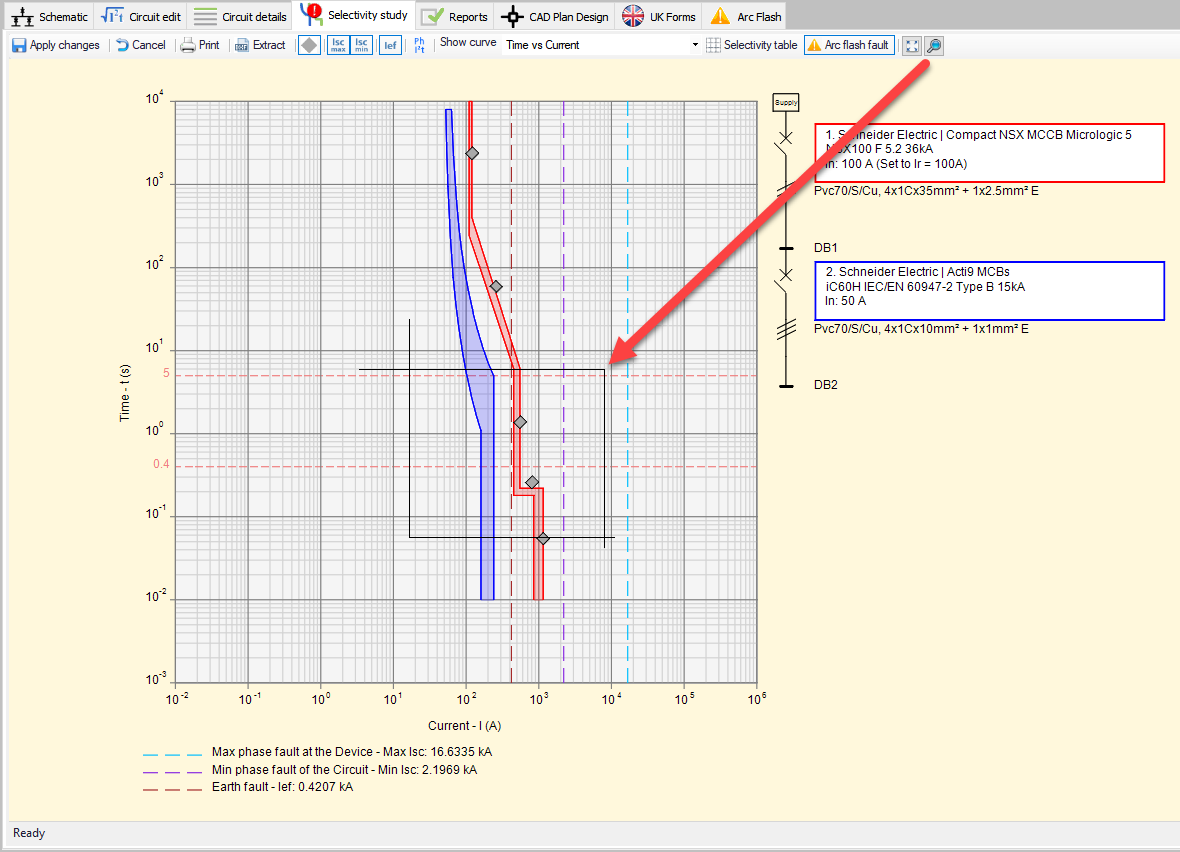
- Show/Hide Device Settings Grips: If a protective device, which settings are adjustable, is selected, then, various diamond shaped grip point will be displayed on the related curve to represent the adjustable values of the protective device. The use can use these grip points to manipulate the related setting by simply by holding left mouse button depressed and moving the grip point. Allowed position which correspond to allowed values will be highlighted by ElectricalOM with green colour when the grip point is selected. It is also need pointing out that these grips will only available on the Time vs Current graph, see below.
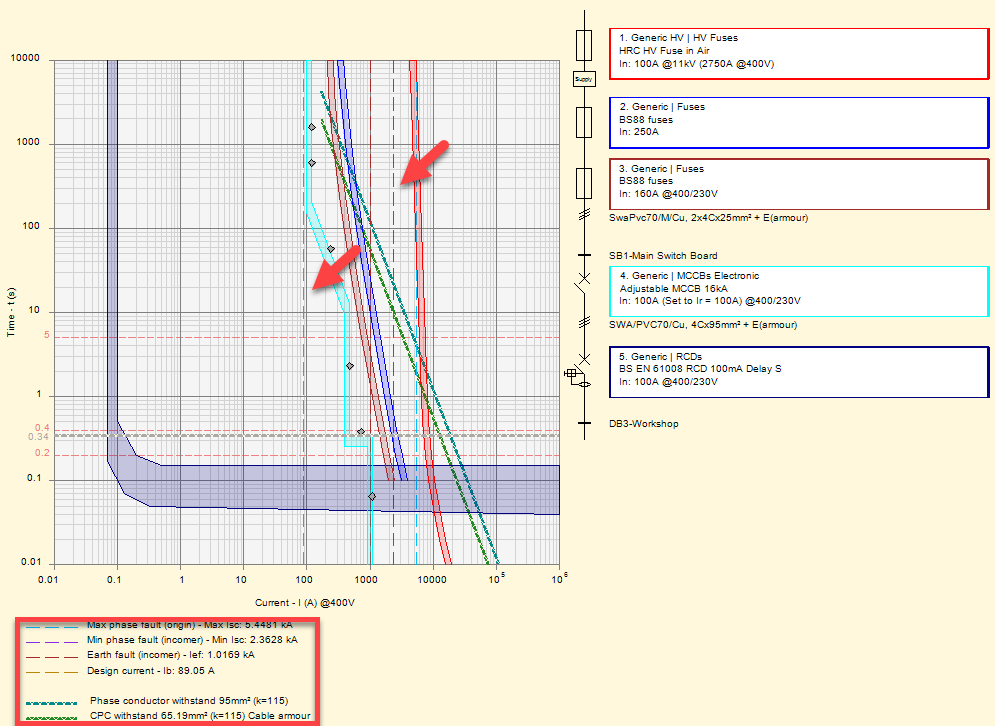
- Ib/Iscmax/Iscmin/Ief/TX/Iarc/Ph I2t/cpc I2t/tef: These buttons will display or hide the corresponding values on the graph with dashed lines. They are colour coded and a legend is available under the graph to describe used colours and the corresponding line together with corresponding values.
- Ib: Design current for the circuit protected by selected protective device.
- Isc max: Maximum fault current for the circuit protected by selected protective device.
- Isc min: Minimum fault current for the circuit protected by selected protective device.
- Ief: Earth fault current for the circuit protected by selected protective device.
- TX: Transformer in-rush current
- Ph I2t: Phase conductor withstand enery for the circuit protected by selected protective device.
- cpc I2t: cpc conductor withstand energy for the circuit protected by selected protective device.
- tef: Earth fault disconnection time for the circuit protected by selected protective device.

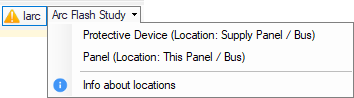
- Iarc button and Arc Flash Study drop-down list will be also available but if Arc Flash Study add-on is not available they will not function. Iarc will dsiplay arc fault values both for origin and incomer points for the selected protective device. Arc Flash Study list will give the user options to visualise arc faults at selected point. For further details, please see Arc Flash Study add-on documentation.
- Grading margin drop-down list in ElectricalOM ensures proper coordination between protective devices in an electrical system. By defining time and current margins, it displays information helppful to judge if there is an unnecessary tripping of upstream devices during faults.
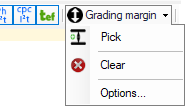
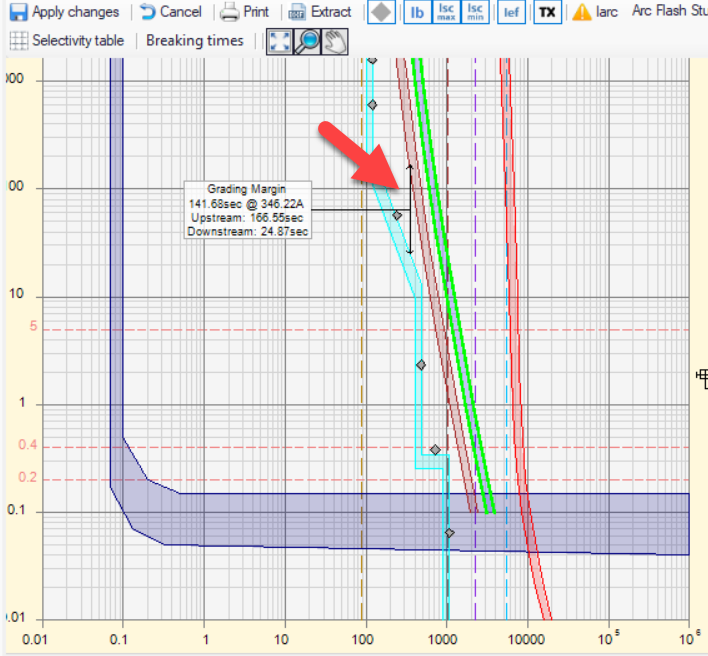
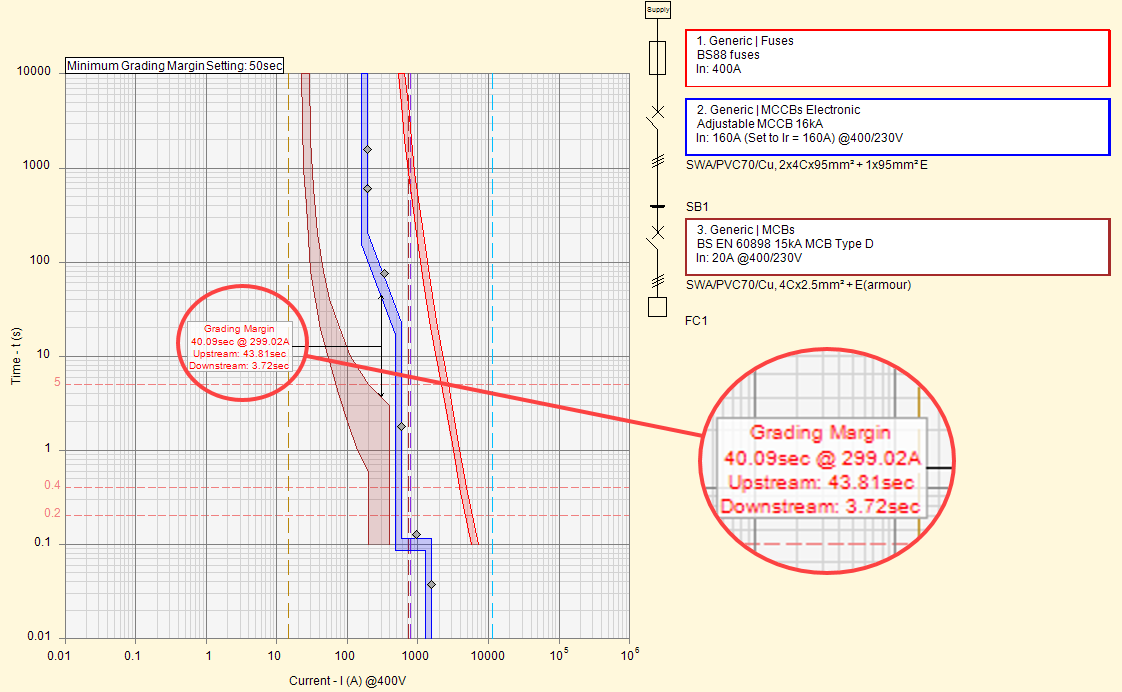
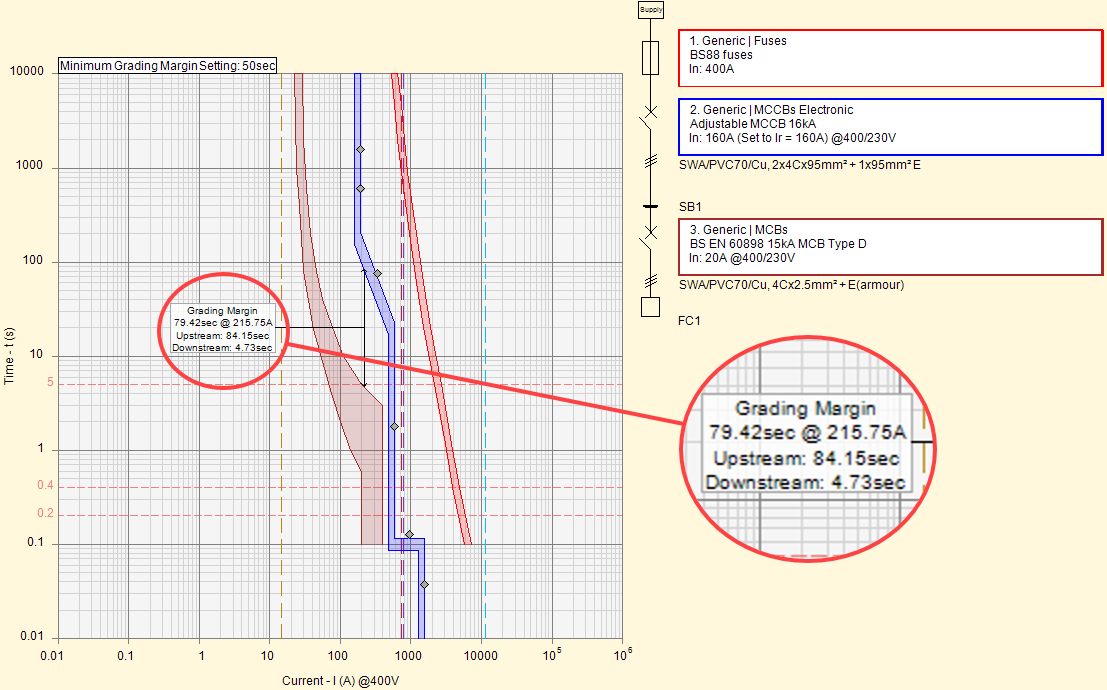
- Pick option will let user to hover over curves to display tripping information. First line displays the time gap between the devices at selected fault level. Second and third line will display details about the disconnection times of downstream and upstream device. Once the left mouse button is clicked, the information will permanently be placed on curves. Margin data is always between protective device upstream and protective device at the selected point.
- Clear will remove all information from the graph area.
- Options
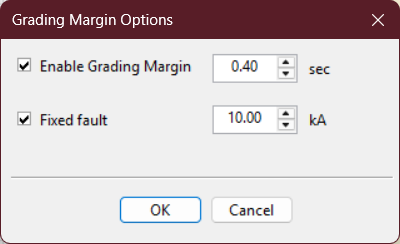
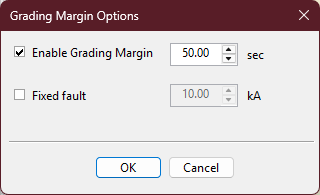
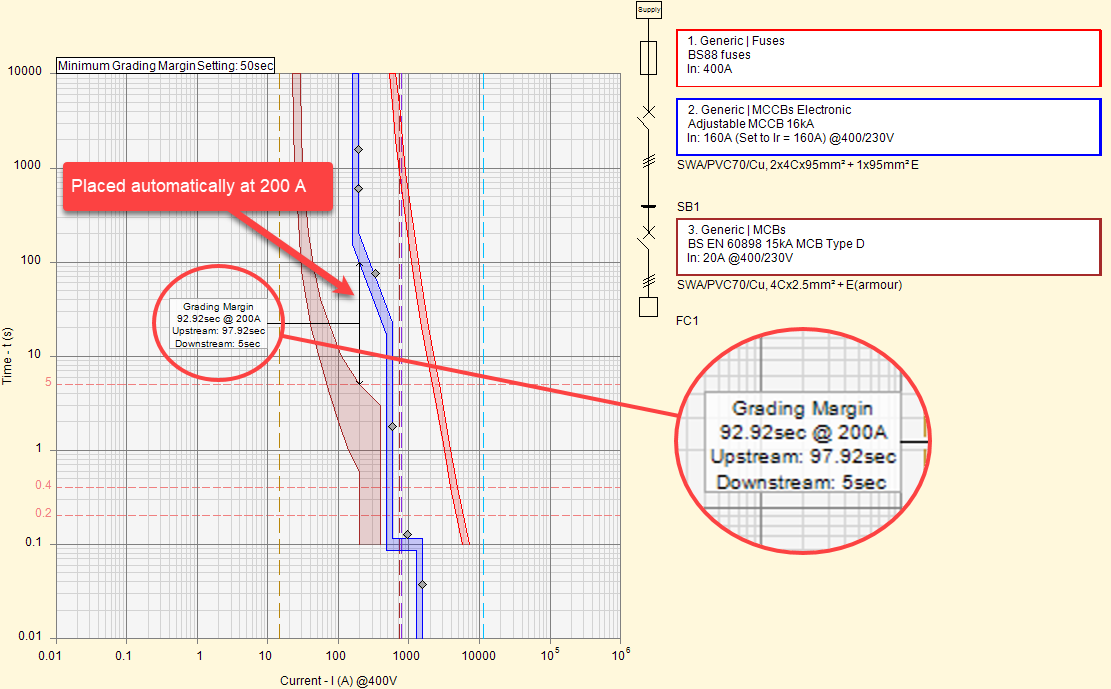
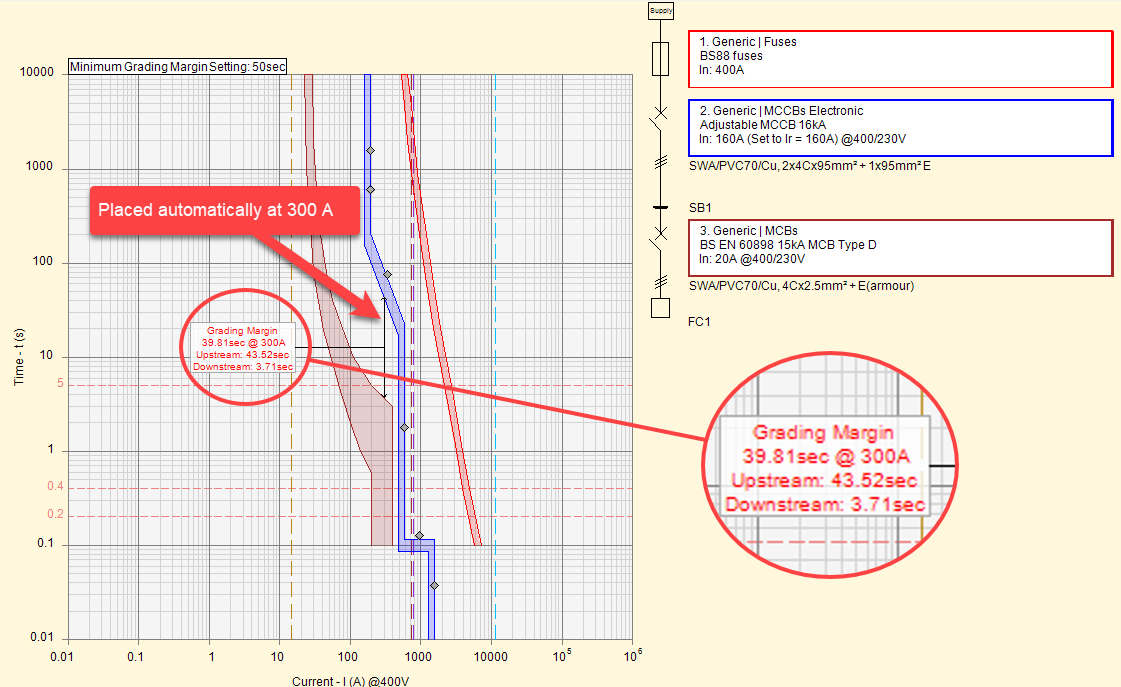
- Enable Grading Margin tick box will enable user to set a specific time in seconds and warn if the disconnection time two devices in question is beyond that set time. In the example below the margin is set to be 50 seconds, and using the Grading Margin drop down list's Pick option, two points are selected. First selection shows when the time is lower than the set margin around 40 seconds where the second shows when the time is above the set margin.
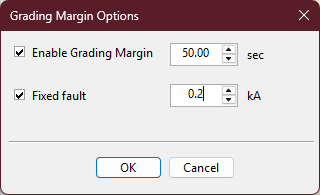
- Fixed fault tick box will place the grading line at the specified fault current in kA. This is helpful if user is looking for a specific value. This option will only be available if Enable Grading Margin option is also enabled. In the example below, fault levels of 200A and 300A are set.
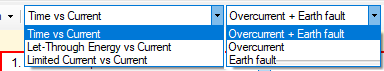
- Curve drop down lists are used to select which graph will be shown in the graphs area. First list can be used to select between:
- Time vs Current, see Time vs Current Graph.
- Let-through Energy vs Current, see Let-through Energy vs Current Graph.
- Limited Current vs Current, see Limited Current vs Current Graph.
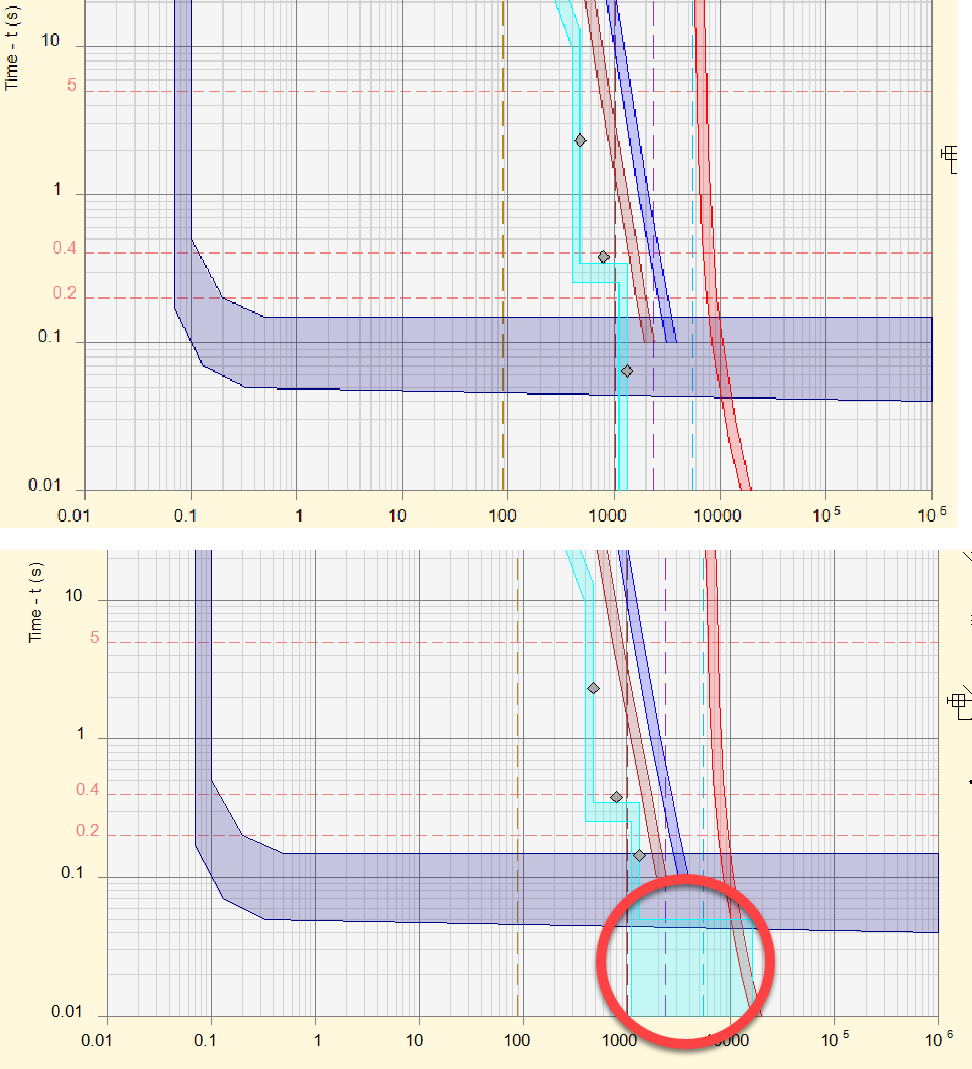
Second list can be used to display only overcurrent, earth fault, or both.
- Selectivity table button, see Selectivity table section.
- Breaking time can be used to display breaking time of devices that this is available.
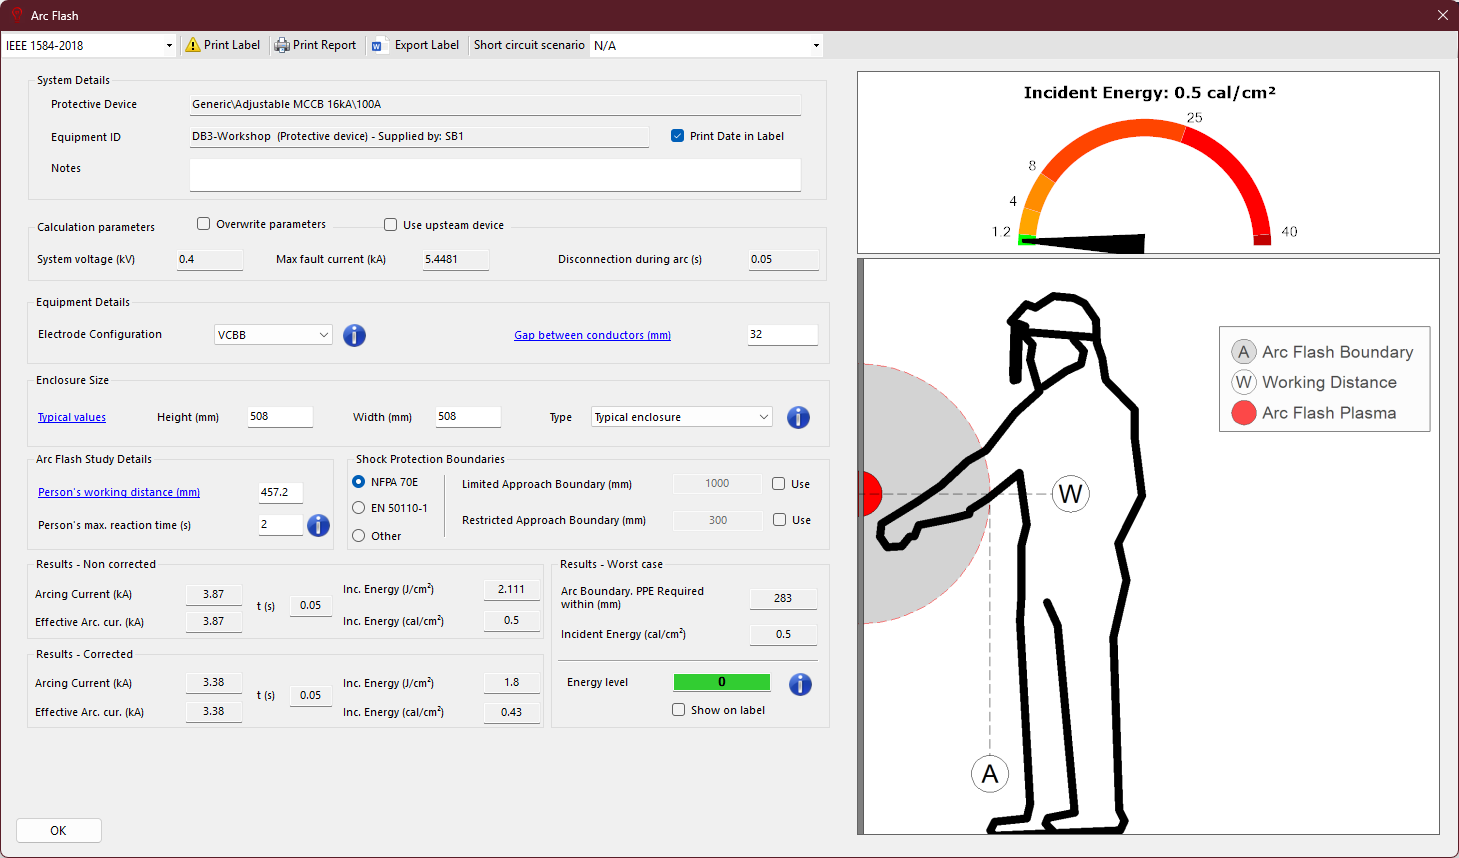
- Arc Flash fault button, see Arc Flash Tab section.
- Zoom to extends button will zoom in or out to fit the graphs and the single time diagram to the screen.
- Zoom button will let the user to select the area to zoom in. In order to use the function, the user need to click on this button and then select an area from the graph or single line diagram area by clicking the left mouse button within the area and dragging the mouse cursor to select the region and clicking again with the left mouse button.
Pan will display a hand symbol on the screen which will let user to scroll within the drawing area while holding the left mouse button.